ETH Price: Will $2,400 Resistance Fall?
MissedBlock Desk · · 4 min read
Updated
Ethereum Recovers Towards $2,370 Amid Cautious Outlook
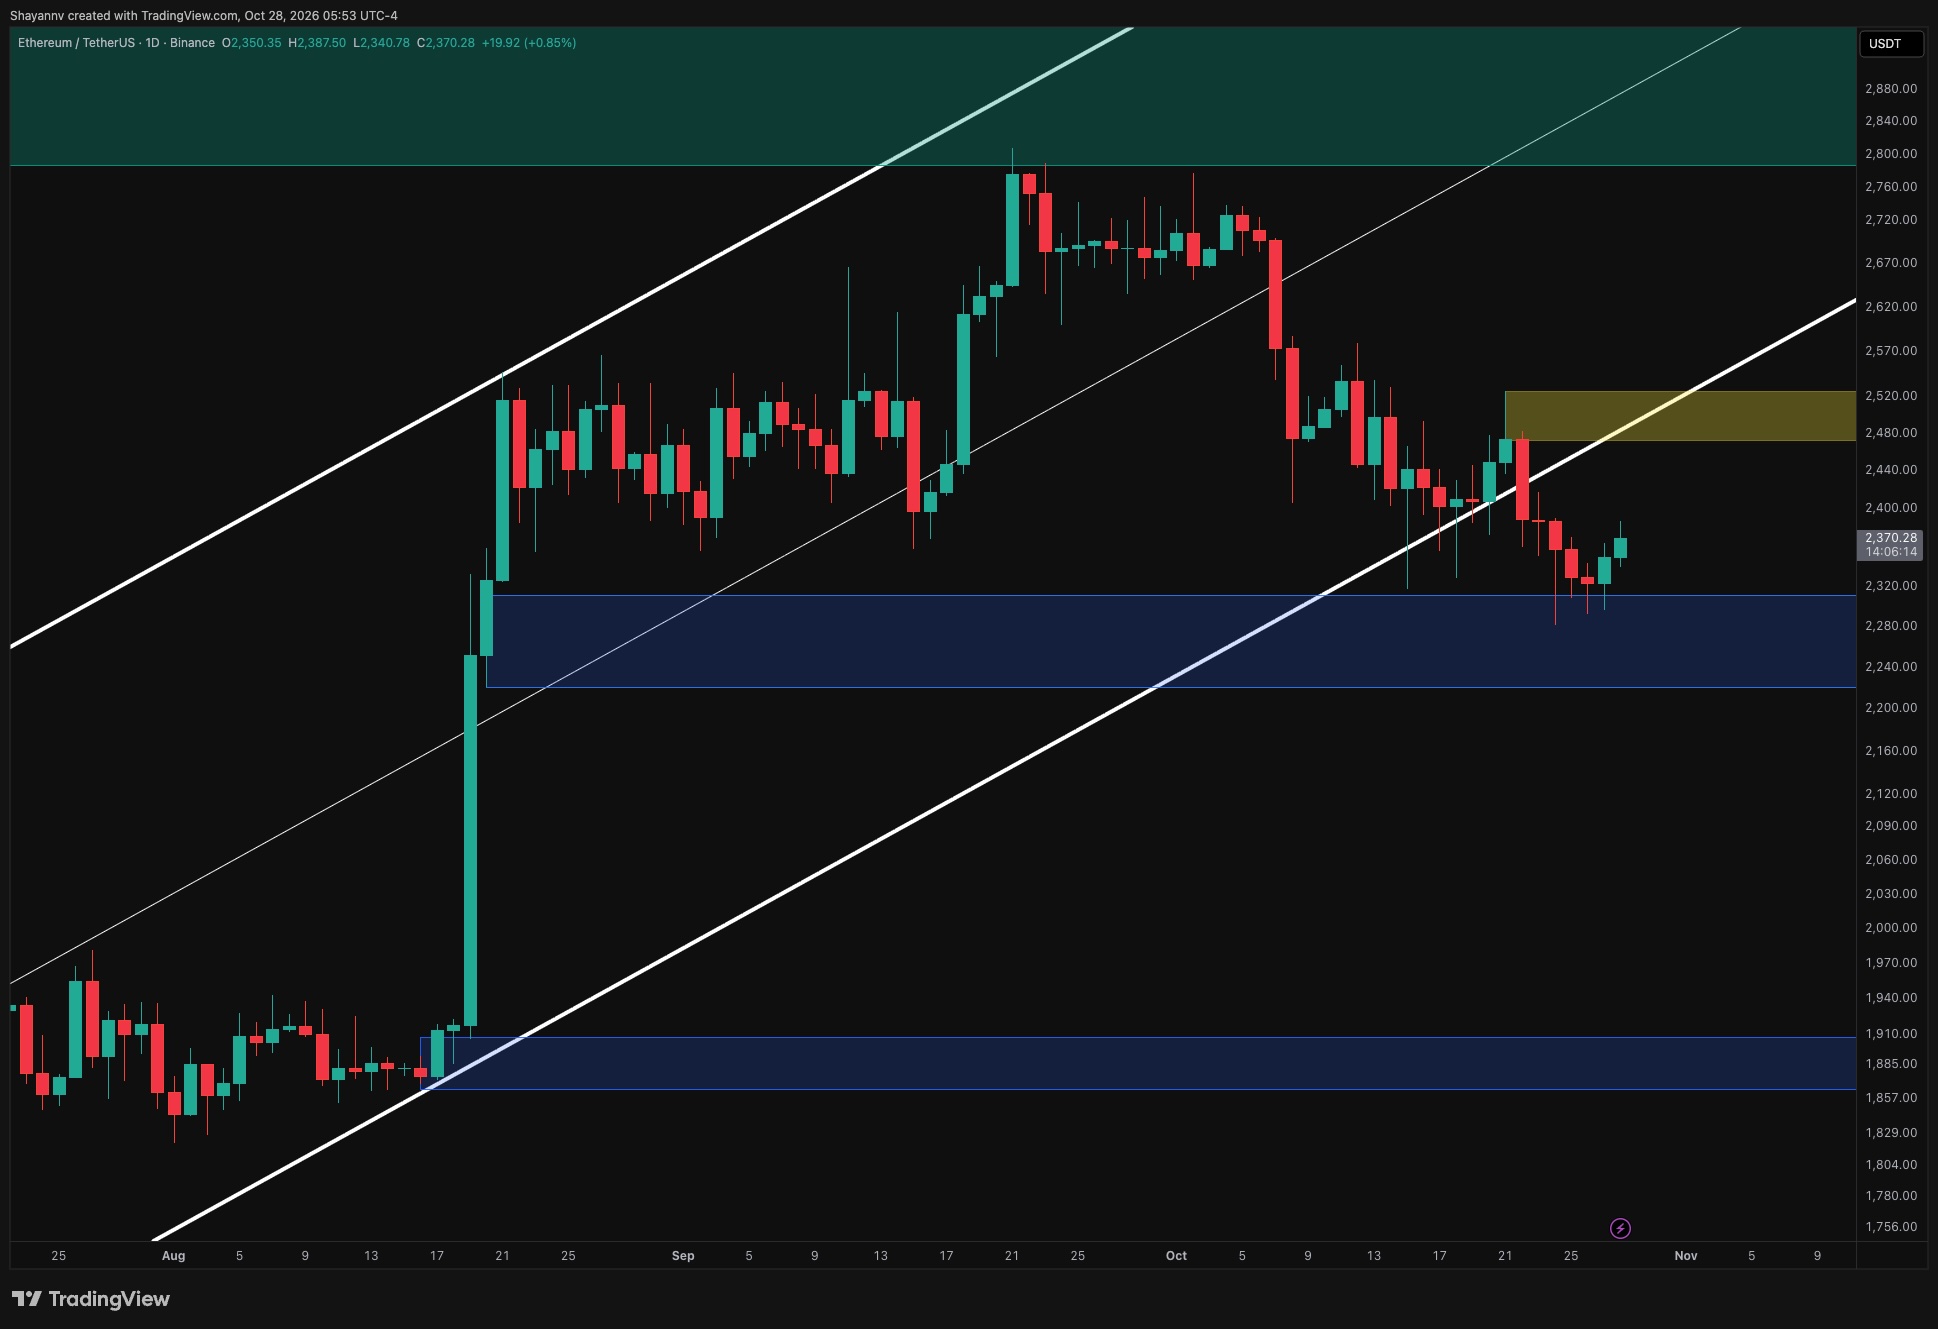
Ethereum has shown signs of recovery, climbing back towards the $2,370 mark after finding buying interest near $2,300. However, this rebound is occurring below a previously established ascending channel, suggesting that the upward momentum may be limited. While initial buyer engagement is evident, the prevailing trend of lower highs continues to cast a shadow of caution over the cryptocurrency’s outlook.
Daily Chart Dynamics
On the daily chart, Ethereum’s recent correction saw it dip into a key demand zone between $2,220 and $2,310 before staging a series of recovery candles. This bounce indicates that buyers are actively defending the upper end of this support area. Nevertheless, this recovery has not yet managed to reverse the bearish structure that took hold following the peak in September.
ETH is currently trading below the former lower boundary of its ascending channel, which now acts as a potential resistance level. This broken structure is further reinforced by a supply zone identified between $2,470 and $2,520, creating a significant hurdle for any sustained price advance.
A sustained hold above $2,310 could pave the way for a further rebound, potentially targeting the $2,400 to $2,440 range, and subsequently the aforementioned supply zone. However, until Ethereum can decisively reclaim the $2,470 to $2,520 supply area and the broken channel boundary, its current upward movement is likely to be viewed as a corrective phase. A renewed downturn below the recent low of approximately $2,280 would expose deeper support levels within the demand zone, potentially pushing prices back towards $2,220.
Four-Hour Chart Perspective
The four-hour chart illustrates Ethereum consolidating around $2,300 before embarking on a recovery within a descending channel. Recent price action has formed a short series of higher lows, propelling the price towards $2,370. Despite this, the broader downtrend remains firmly in place.
The immediate resistance area is situated between $2,390 and $2,420, where prior consolidation might attract renewed selling pressure. A successful breach of this region would bring the descending channel’s upper boundary, around $2,460 to $2,480, into focus. This level, coinciding with the $2,470 to $2,520 supply zone, presents a particularly critical test for buyers.
Conversely, a rejection from this resistance, followed by a loss of the recent recovery base between $2,330 and $2,350, would heighten the risk of another test of the support zone between $2,270 and $2,310. A sustained break below $2,270 would likely signal a continuation of the downtrend, with prices potentially falling towards the lower end of the daily demand zone near $2,220.
Liquidation Heatmap Insights
The two-week Binance ETH/USDT liquidation heatmap reveals significant liquidation concentrations situated above the current recovering price. Bands of potential liquidations are observed around $2,390 to $2,400 and $2,430 to $2,440, which could become relevant if the rebound gains traction. A broader concentration of liquidations remains clustered around $2,520 to $2,550.
The cluster at $2,430 to $2,440 lies below the primary technical supply zone. A move through this level could trigger short liquidations, potentially accelerating the rebound towards descending resistance. However, such an acceleration would not, in itself, confirm a broader bullish reversal.
Below the current price, a prominent liquidation band is noted around $2,270 to $2,290, with additional concentrations extending towards $2,220 to $2,250. A failure to maintain the recent recovery structure could bring these liquidity pools back into play, potentially amplifying any decline through long liquidations. For the moment, the heatmap suggests the possibility of a short-term liquidity-driven rebound, while the underlying technical trend remains bearish beneath overhead supply.