Ethereum Eyes $2K Amidst Growing Bearish Sentiment
MissedBlock Desk · · 3 min read
Updated
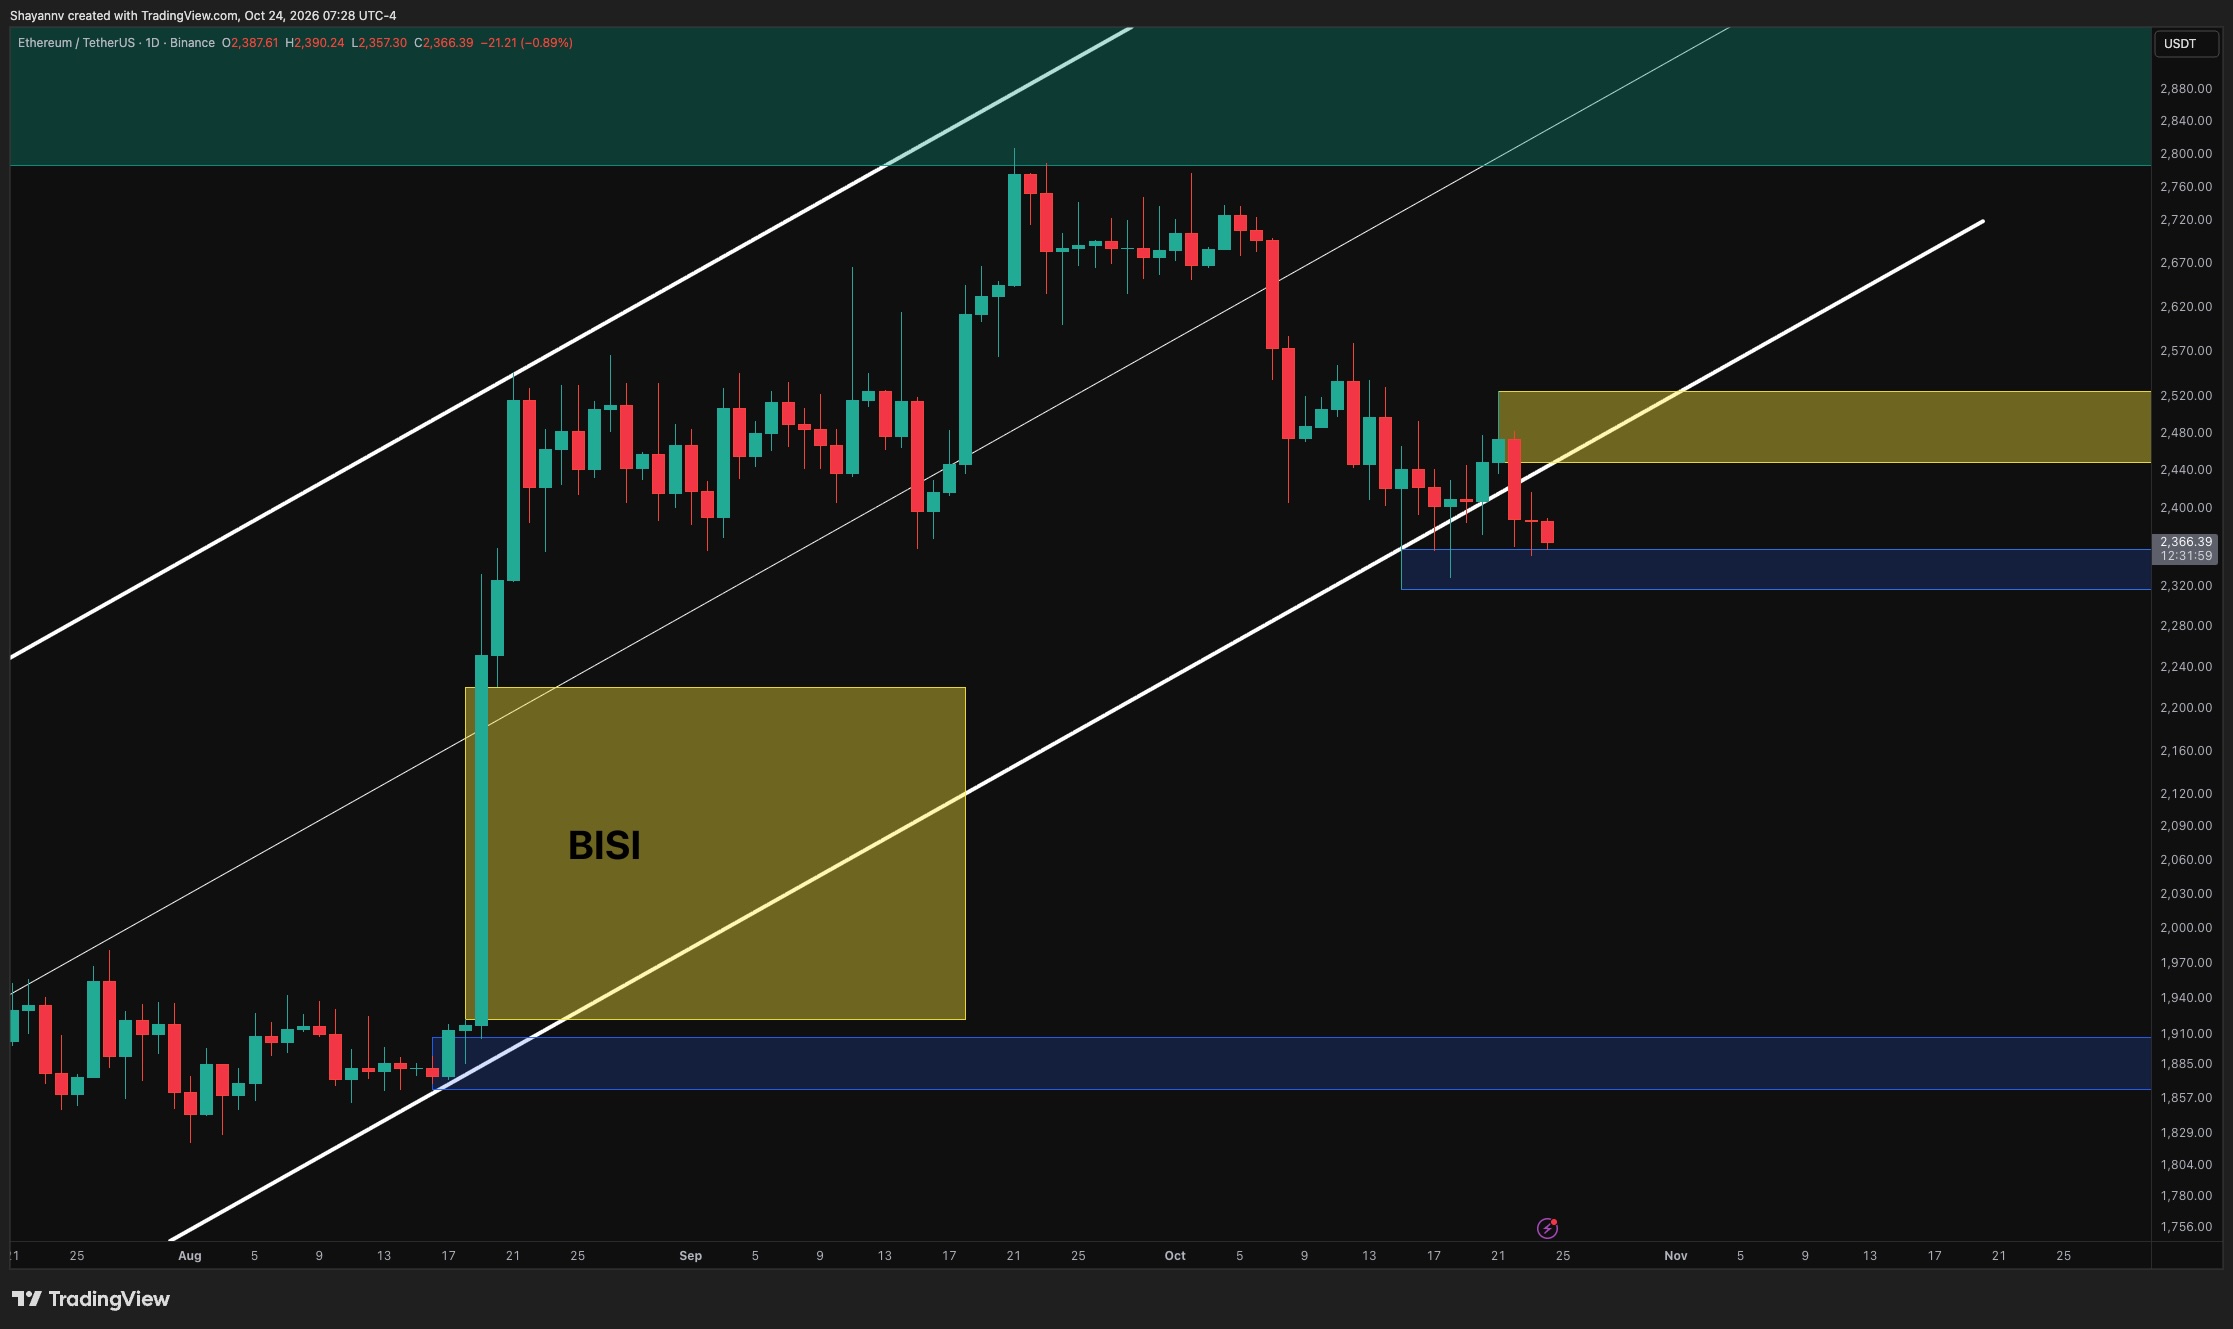
Ethereum’s failed rebound has triggered renewed selling pressure, pushing its price back near $2,370 and below its established ascending channel. With futures taker activity also leaning towards dominance by sellers, the outlook favors a continued bearish trend unless buyers can reclaim key resistance levels.
On the daily chart, Ethereum has fallen below the lower boundary of its ascending channel following a recent recovery that faltered within the $2,440 to $2,520 supply zone. The subsequent bearish candles indicate that the attempted rebound provided sellers an opportunity to reduce their positions, while buyers have struggled to re-establish the previous price structure.
The immediate support level is now the highlighted $2,320 to $2,360 demand zone. A sustained close below this area would further solidify the breakdown scenario and expose the upper boundary of a marked bullish imbalance, or BISI, situated around $2,220. This imbalance extends down to $1,920 and represents the price gap left by August’s rapid ascent. A deeper retracement into this zone is possible if demand falters, though a complete fill is not guaranteed.
Conversely, holding the current support could lead to another temporary bounce. However, for Ethereum to significantly weaken the bearish outlook, it would need to reclaim the broken channel boundary and establish acceptance above the $2,440 to $2,520 supply zone.
Technical Indicators Point to Seller Control
The 4-hour chart reveals a consistent pattern of lower highs, with the latest rebound being rejected from the $2,470 to $2,500 supply zone. Ethereum has since retreated towards the $2,320 to $2,360 demand region, indicating that sellers remain in control of the immediate price action.
Despite repeated tests of this support level, which have generated sharp reactions, these rebounds have failed to sustain upward momentum. A decisive break below $2,320 would confirm a fresh lower low and increase the probability of a further decline towards the daily imbalance near $2,220.
For buyers, regaining the $2,400 to $2,420 area would represent an initial improvement. However, the more significant barrier remains the $2,470 to $2,500 supply zone. Beyond that, a secondary supply zone located between $2,540 and $2,580 could cap any further gains. Until these lower-high regions are reclaimed, rebounds are likely to remain vulnerable to renewed selling pressure.
Futures Market Shows Dominant Selling
The Ethereum Futures Taker CVD chart, which tracks whether aggressive buying or selling dominates over a rolling 90-day period, has shifted from neutral to taker-sell dominant. This is indicated by red readings accompanying Ethereum’s recent retreat towards $2,400.
This transition suggests that futures volume initiated by sellers has gained the upper hand, reinforcing the weakness observed in the price structure. Unlike metrics that measure trade size without indicating direction, this indicator provides evidence of dominant aggressive selling within the observed timeframe.
Persistent sell dominance would heighten the risk of a breakdown through the $2,320 to $2,360 demand zone, especially if buyers continue to struggle to gain traction on rebounds. A shift back towards neutral or buy-dominant conditions, coupled with a recovery above nearby supply levels, would offer stronger evidence that selling pressure is abating. For now, futures order flow supports a cautious, bearish bias.